Solving the pitfalls of single-run measurement permitted by CISPR 14-1 edition 7
New challenges in click analysis
The seventh edition of the CISPR 14-1 standard puts an accent on the technological progress of click analyzers, whose dynamic range needs to be wide enough to detect much more than the apparent lowest and highest quasi-peak readings at a time so they can complete the measurement in a single run.
Designed to make it faster and less costly to perform a complete standard-compliant click measurement, recent technology makes use of state-of-the-art Fast Fourier Transform (FFT) EMI receivers, which can cover all four of the required frequencies simultaneously.
Rather than needing four distinct receivers or four instances to complete a measurement, today’s FFT-based instruments do everything at once. Though this is clearly an advantage, they do have certain pitfalls:
– The reduced dynamic range, emphasized in FFT receivers and single-run systems, can lead to undermeasurement.
– As single-run systems consider only the amplitude of the disturbance but not its shape in time, they are susceptible to erroneous click analysis.
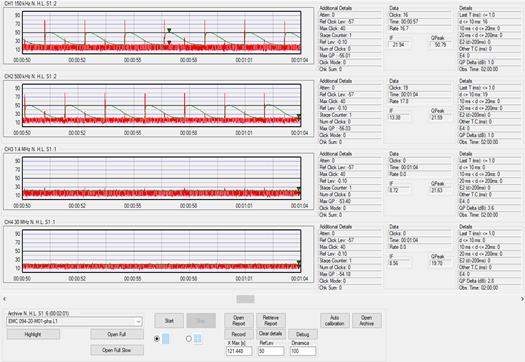
In Fig. 1, the red and green plotlines are simultaneous, gapless, real-time representations of the IF level and quasi-peak detector output with a resolution of 500 μs, as required by the standard. A very short pulse signal, for example a click disturbance lasting less than 1 ms, shows a high peak IF level and a modest quasi-peak detection. During the first run of the measurement process, at least 40 dB of instantaneous linear dynamic range is required to carry out this step correctly.
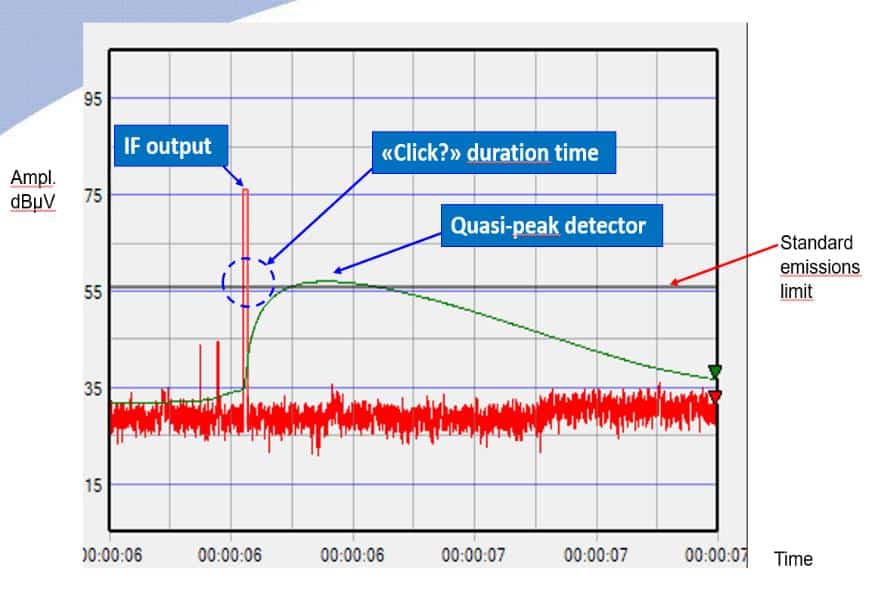
For the second run, the limit threshold could increase by as much as 44 dB depending on the click rate, according to the relaxed CISPR parameter:
44 dB for N < 0.2
or
20 LOG (30 / N) dB for 0.2 ≤ N < 30
In other words, a clean 84 dB of dynamic range is needed to complete a reliable measurement in a single run. As we can calculate with the formula 20 LOG (30 MHz / 9 kHz), which takes into account the 30 MHz total input bandwidth and the 9 kHz CISPR IF bandwidth, about 70 dB is irremediably lost by a standard 0 to 30 MHz receiver. Moreover, since the threshold level can be non-flat for the four frequencies required by the standard (depending on the equipment under test), a single attenuator for the entire band would have to be set for the highest limit to avoid saturation, thus wasting an additional 10 dB.
Benefits of the PMM CA0010 click analyzer
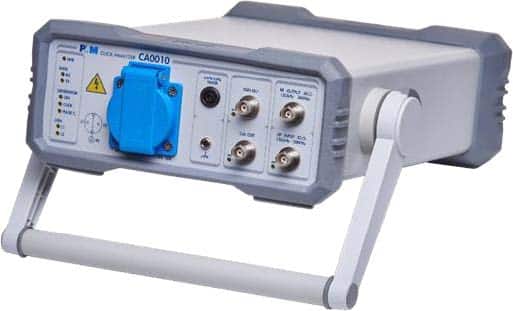
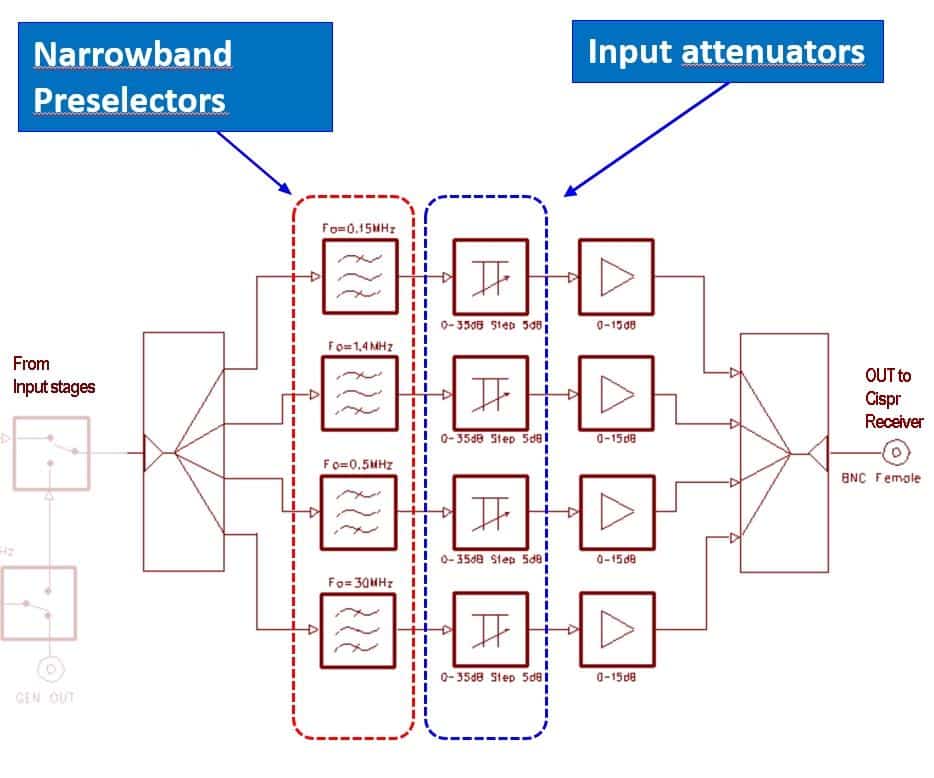
The PMM CA0010 (Fig. 2) is equipped with narrow preselection filters and independent attenuators for each single channel, as depicted in Fig. 3. These additional filters are tailored for CISPR 14 measurements; along with the specific attenuators, they are separate from and precede the filters of the ordinary preselector. This solution, combined with the high dynamic capability of the input circuits, makes it possible to manage signals of very different amplitudes as are typical of click disturbances.
The innovative design of the PMM CA0010, with its dedicated hardware, aims to overcome all of the pitfalls described above. Another advantage of this product is that while it measures clicks, it displays and records in real time a complete set of data: number, time, level, duration, etc. This can be done during development and/or debugging, so problems can be identified long before the production phase, saving considerable time and money.
Reliable recording is also crucial for storing automated documentation of measurement results. Highly detailed data allows further investigation and comparisons that are impossible with basic summary tables. PMM CA0010 strip charts (examples in Fig. 1 and Fig. 4) let the user view signals over the entire test time to identify closely- and widely-spaced discontinuities. The output also shows the limits prescribed by the standard for the purpose of immediate comparison. The full set of data is stored in the PC and can be reloaded at any time for further investigation.
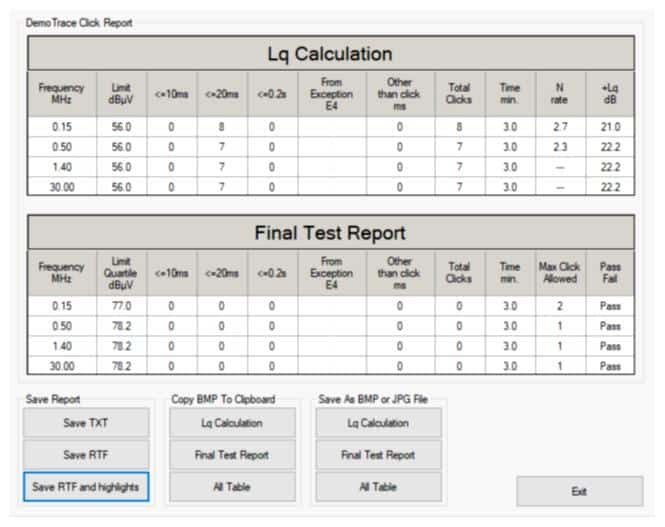
The final test report can be exported in easy-to-use TXT format, or as a more flexible and detailed PDF or RTF file.
Reports can be recalled whenever needed and in any of these common formats. An example is shown in Fig. 5.
Conclusion
The FFT technique and the powerful computing boards that are now widely available enable the simultaneous click measurement of all required frequencies. However, this numerical approach alone cannot overcome all the physical limitations associated with the measurement of discontinuous disturbances.
For example, the receiver must be able to detect very low signals while not getting saturated with very high disturbances. This makes channel-individual input filters and attenuators indispensable. Narrowband frequency preselection at the RF input is necessary for ensuring CISPR compliance in a single run.
The PMM CA0010 is not only equipped with this additional hardware but comes with an internal 16 A LISN, internal reference and calibration generator. Click analysis and click generation software are also provided.
View all PMM products available from MDL Technologies
Want further information, advice or a quote? Speak with our expert consultants about any of the PMM products available on 01462 431981, or contact us here.